SPIKESfunc
  • Dose-Response Visualiser
  • Schild Plot Generator
  • Schild Plot Analysis Quiz
  • -logKi Values

Dose-Response Visualiser


  • Agonist
  • Competitive Antagonist
  • Irreversible Antagonist
  • Allosteric Antagonist (Affinity)
  • Allosteric Antagonist (Efficacy)
  • Functional Antagonist

 Agonist

Agonist

Observe the effects of changing the characteristics of the Agonist (affinity, intrinsic efficacy) and/or the Cell (receptor density, efficiency of coupling) by moving the red slider along the grey bar to the right or left to increase or decrease the value of the characteristic, respectively.

Agonist Chart

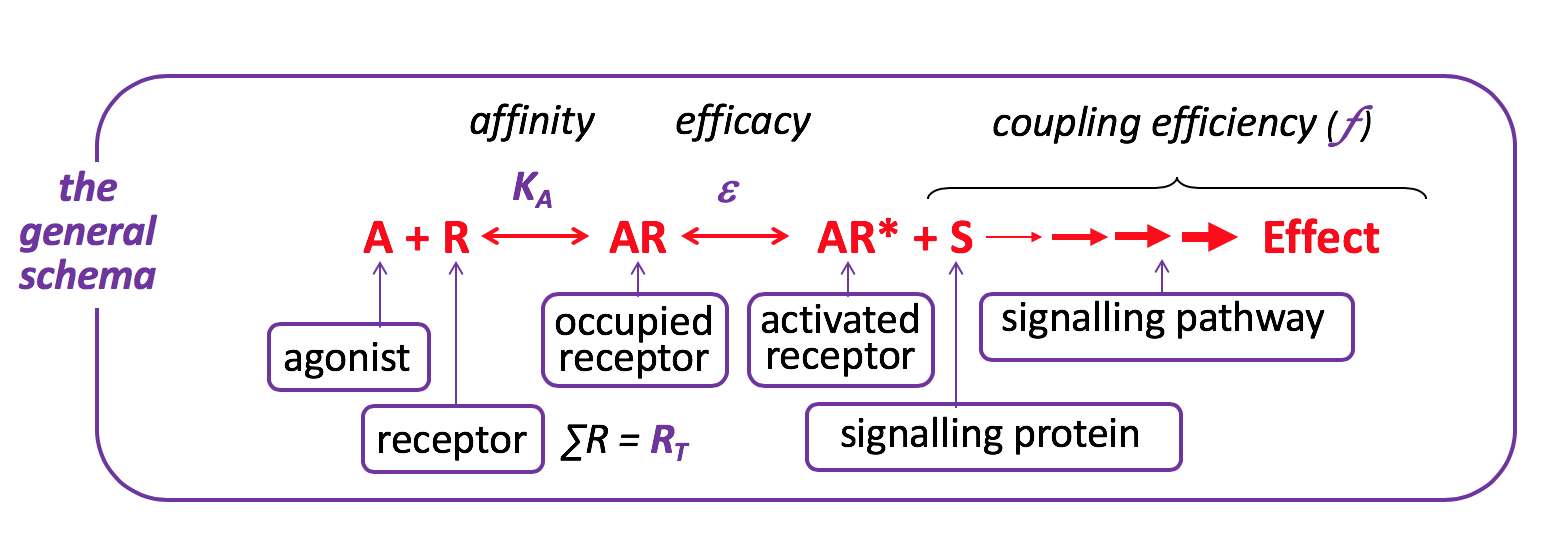
Some clinically-used drugs act as agonists – e.g. salbutamol at the β2-adrenoceptor, adrenaline at various adrenoceptors, morphine at opioid receptors, etc.

Agonist

Affinity

Affinity is a measure of the strength of binding of a drug to a receptor (both agonists and antagonists have affinity), and depends on the existence of chemical forces of attraction between the agonist and the receptor binding site (e.g. most commonly ionic bonds, hydrogen bonds, van der Waals forces). The strength of binding (affinity) depends upon the respective 3-D structures of the agonist and binding site – the strength of binding dissipates markedly as the distance between the agonist and binding site increases. High affinity agonists bind to binding sites at low concentrations, whereas low affinity agonists bind at higher concentrations. The affinity of ligands (agonists and antagonists) can be quantitated using the Equilibrium Dissociation Constant (KA), which is the concentration of ligand needed to occupy (bind to) 50% of receptors. KA is also the ratio of the rate the ligand (agonist or antagonist) leaves the receptor binding site (koff) and the rate it approaches the receptor binding site (kon). The KA value is inversely proportional to the affinity (high affinity ligands have low KA values) and is typically measured in drug binding assays (plots of [ligand] versus fractional receptor occupancy). As the [ligand] increases the fraction of receptor bound increases nonlinearly (rectangular hyperbolic function) to form a maximal asymptote (from which RT can be determined). Colloquially, “affinity is what brings the drug to the receptor”.


Intrinsic Efficacy

Intrinsic Efficacy is the property of the agonist that enables it, once bound, to change the conformation of the receptor (activation), such that it alters the activity of downstream signalling pathways to produce a change in cellular activity. Efficacy is measured in relative terms, having no absolute scale – but different ligands have clearly different efficacies – full agonists have higher efficacies than partial agonists, and antagonists typically have no efficacy (bind to but don’t activate the receptor). Thus, different agonists have different inherent capacities to induce a response, and equal cellular responses can be achieved by different fractional receptor occupancies. Colloquially, efficacy is “what the drug does once it binds to the receptor”.

Cell

Receptor Density

Receptor Density is the total number of receptors, expressed in terms of unit area of membrane, or per cell, or per unit mass of protein. Proportional to the quantity Bmax (the maximal specific binding of a ligand, often expressed in units of mol ligand/mg protein, or ligands bound/cell) measured in radioligand binding studies. The relationship between Bmax and N is influenced by the number of ligand binding sites possessed by each receptor. For most receptors there is one binding site for the endogenous agonist, although for ligand-gated ion channels (e.g. nicotinic acetylcholine receptor), this is generally more than one.


Coupling Efficiency

Coupling Efficiency is a cell-dependent parameter describing the efficiency of the signalling pathways that couple (link) the activated receptor to the measured effect. Some cells have high coupling efficiencies, meaning that activation of a relatively small number of receptors can lead to a large cellular response. Other cells may have low coupling efficiencies (perhaps due to low expression / activity of a key signalling pathway component) and high levels of receptor activation may produce relatively small cellular responses.

Questions
There are no more questions. Would you like to try again?

Answer

Agonist Dose Response Curve
 Competitive Antagonist

Competitive Antagonist

Competitive antagonists bind reversibly to the same binding site on the receptor as the agonist (orthosteric binding). Thus, which molecule occupies the common binding site depends solely on the relative affinity and concentrations of the agonist and competitive antagonist. Thus, theoretically the [agonist] can be raised to the point that the concomitant receptor binding by the antagonist is minimal – at this point the maximum effect of the agonist will be observed, that is competitive antagonism is surmountable. The affinity of a competitive antagonist for a receptor can be determined from binding assays (saturation (KA) and/or competition binding (Ki) assays using radioligands) and from functional assays (KB, by measuring the rightward shift of agonist dose-response curves in the presence of increasing [competitive antagonist] – Schild analysis). Although the constants KA, Ki and KB are determined using different experimental approaches, they each represent the affinity of the competitive antagonist for a receptor, and thus should have the same molar value (the concentration required to occupy 50% of receptors).

Competitive Chart

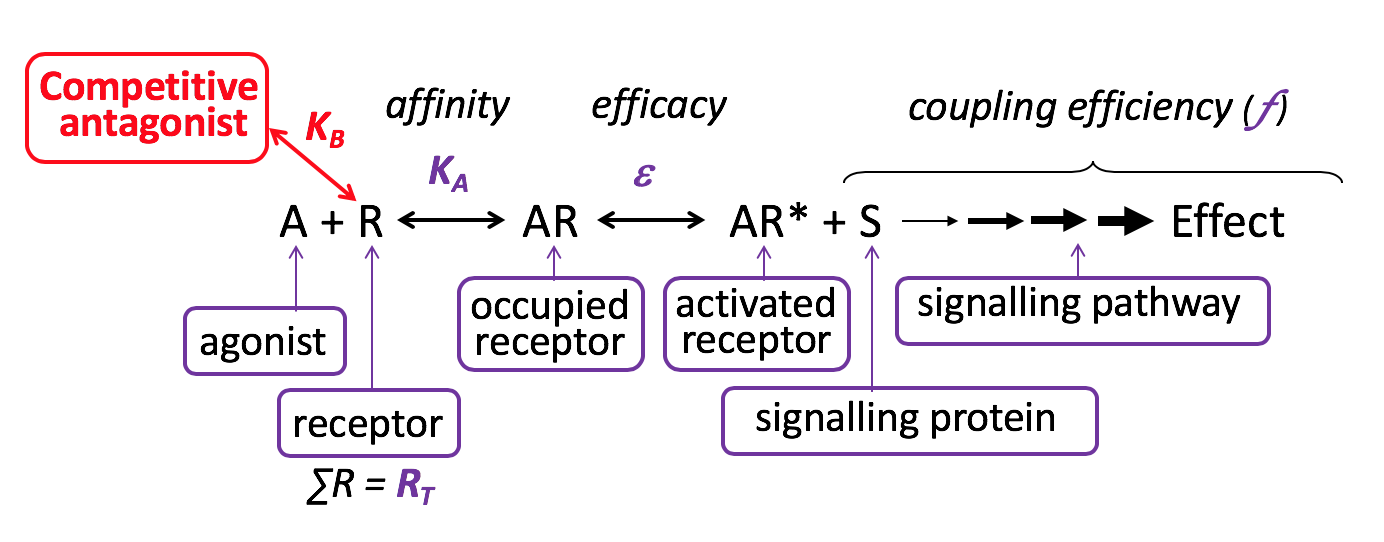
The vast majority of clinically-used receptor antagonists are considered to act competitively – e.g. metoprolol at the β-adrenoceptor, atropine at the muscarinic cholinoceptor, losartan at the angiotensin AT1 receptor, etc.

Agonist

Affinity

Affinity is a measure of the strength of binding of a drug to a receptor (both agonists and antagonists have affinity), and depends on the existence of chemical forces of attraction between the agonist and the receptor binding site (e.g. most commonly ionic bonds, hydrogen bonds, van der Waals forces). The strength of binding (affinity) depends upon the respective 3-D structures of the agonist and binding site – the strength of binding dissipates markedly as the distance between the agonist and binding site increases. High affinity agonists bind to binding sites at low concentrations, whereas low affinity agonists bind at higher concentrations. The affinity of ligands (agonists and antagonists) can be quantitated using the Equilibrium Dissociation Constant (KA), which is the concentration of ligand needed to occupy (bind to) 50% of receptors. KA is also the ratio of the rate the ligand (agonist or antagonist) leaves the receptor binding site (koff) and the rate it approaches the receptor binding site (kon). The KA value is inversely proportional to the affinity (high affinity ligands have low KA values) and is typically measured in drug binding assays (plots of [ligand] versus fractional receptor occupancy). As the [ligand] increases the fraction of receptor bound increases nonlinearly (rectangular hyperbolic function) to form a maximal asymptote (from which RT can be determined). Colloquially, “affinity is what brings the drug to the receptor”.


Intrinsic Efficacy

Intrinsic Efficacy is the property of the agonist that enables it, once bound, to change the conformation of the receptor (activation), such that it alters the activity of downstream signalling pathways to produce a change in cellular activity. Efficacy is measured in relative terms, having no absolute scale – but different ligands have clearly different efficacies – full agonists have higher efficacies than partial agonists, and antagonists typically have no efficacy (bind to but don’t activate the receptor). Thus, different agonists have different inherent capacities to induce a response, and equal cellular responses can be achieved by different fractional receptor occupancies. Colloquially, efficacy is “what the drug does once it binds to the receptor”.

Cell

Receptor Density

Receptor Density is the total number of receptors, expressed in terms of unit area of membrane, or per cell, or per unit mass of protein. Proportional to the quantity Bmax (the maximal specific binding of a ligand, often expressed in units of mol ligand/mg protein, or ligands bound/cell) measured in radioligand binding studies. The relationship between Bmax and N is influenced by the number of ligand binding sites possessed by each receptor. For most receptors there is one binding site for the endogenous agonist, although for ligand-gated ion channels (e.g. nicotinic acetylcholine receptor), this is generally more than one.


Coupling Efficiency

Coupling Efficiency is a cell-dependent parameter describing the efficiency of the signalling pathways that couple (link) the activated receptor to the measured effect. Some cells have high coupling efficiencies, meaning that activation of a relatively small number of receptors can lead to a large cellular response. Other cells may have low coupling efficiencies (perhaps due to low expression / activity of a key signalling pathway component) and high levels of receptor activation may produce relatively small cellular responses.

Competitive Antagonist
Questions
There are no more questions. Would you like to try again?

Answer

Effect of a Competitive Antagonist on Agonist Dose Response Curve
 Irreversible Antagonist

Irreversible Antagonist

An irreversible antagonist binds covalently (not reversibly) to the same binding site on the receptor as the agonist (orthosteric binding), without activating the receptor. Such antagonists irreversibly inhibit agonist-induced responses, until new functional receptors are expressed by the cell. Irreversible antagonism is one form of non-competitive antagonism.

Irreversible Chart

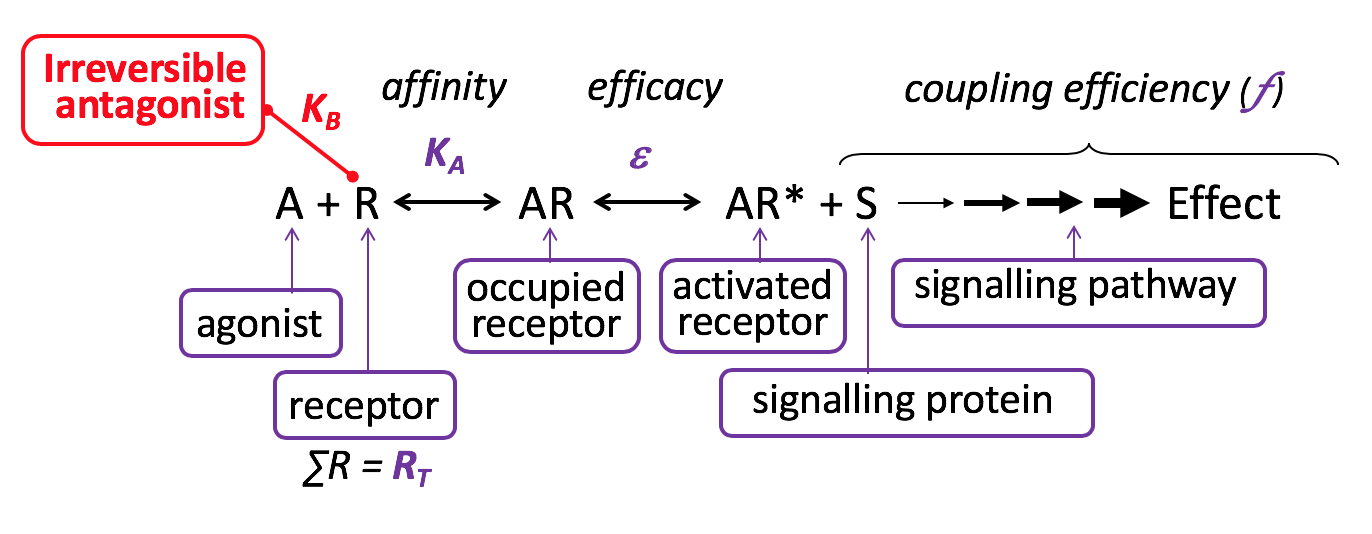
Relatively few clinically-used receptor antagonists are considered to act irreversibly – e.g. naloxazone at the opioid mu receptor, phenoxybenzamine at the α adrenoceptor. Some drugs act ‘pseudoirreversibly’ and occupy the orthosteric binding site for relatively long periods without forming a covalent bond e.g. tiotropium at the muscarinic cholinoceptor

Agonist

Affinity

Affinity is a measure of the strength of binding of a drug to a receptor (both agonists and antagonists have affinity), and depends on the existence of chemical forces of attraction between the agonist and the receptor binding site (e.g. most commonly ionic bonds, hydrogen bonds, van der Waals forces). The strength of binding (affinity) depends upon the respective 3-D structures of the agonist and binding site – the strength of binding dissipates markedly as the distance between the agonist and binding site increases. High affinity agonists bind to binding sites at low concentrations, whereas low affinity agonists bind at higher concentrations. The affinity of ligands (agonists and antagonists) can be quantitated using the Equilibrium Dissociation Constant (KA), which is the concentration of ligand needed to occupy (bind to) 50% of receptors. KA is also the ratio of the rate the ligand (agonist or antagonist) leaves the receptor binding site (koff) and the rate it approaches the receptor binding site (kon). The KA value is inversely proportional to the affinity (high affinity ligands have low KA values) and is typically measured in drug binding assays (plots of [ligand] versus fractional receptor occupancy). As the [ligand] increases the fraction of receptor bound increases nonlinearly (rectangular hyperbolic function) to form a maximal asymptote (from which RT can be determined). Colloquially, “affinity is what brings the drug to the receptor”.


Intrinsic Efficacy

Intrinsic Efficacy is the property of the agonist that enables it, once bound, to change the conformation of the receptor (activation), such that it alters the activity of downstream signalling pathways to produce a change in cellular activity. Efficacy is measured in relative terms, having no absolute scale – but different ligands have clearly different efficacies – full agonists have higher efficacies than partial agonists, and antagonists typically have no efficacy (bind to but don’t activate the receptor). Thus, different agonists have different inherent capacities to induce a response, and equal cellular responses can be achieved by different fractional receptor occupancies. Colloquially, efficacy is “what the drug does once it binds to the receptor”.

Cell

Receptor Density

Receptor Density is the total number of receptors, expressed in terms of unit area of membrane, or per cell, or per unit mass of protein. Proportional to the quantity Bmax (the maximal specific binding of a ligand, often expressed in units of mol ligand/mg protein, or ligands bound/cell) measured in radioligand binding studies. The relationship between Bmax and N is influenced by the number of ligand binding sites possessed by each receptor. For most receptors there is one binding site for the endogenous agonist, although for ligand-gated ion channels (e.g. nicotinic acetylcholine receptor), this is generally more than one.


Coupling Efficiency

Coupling Efficiency is a cell-dependent parameter describing the efficiency of the signalling pathways that couple (link) the activated receptor to the measured effect. Some cells have high coupling efficiencies, meaning that activation of a relatively small number of receptors can lead to a large cellular response. Other cells may have low coupling efficiencies (perhaps due to low expression / activity of a key signalling pathway component) and high levels of receptor activation may produce relatively small cellular responses.

Irreversible Antagonist
Questions
There are no more questions. Would you like to try again?

Answer

Effect of an Irreversible Antagonist on Agonist Dose Response Curve
 Allosteric Antagonist

Allosteric Antagonist (Affinity)

Allosteric antagonists bind reversibly to receptors, without activating the receptor, at a site that is different from the agonist binding site. Allosteric antagonists reduce agonist affinity &/or efficacy, thereby inhibiting agonist-induced effects. They are also referred to as negative allosteric modulators (NAMs). Unlike competitive antagonists, the effects of an allosteric antagonist are saturable – this is because once the allosteric site is saturated, there are no further allosteric effects on the agonist. Allosteric antagonism is another form of non-competitive antagonism, as a receptor can bind both the agonist and the allosteric antagonist simultaneously.

Affinity Chart

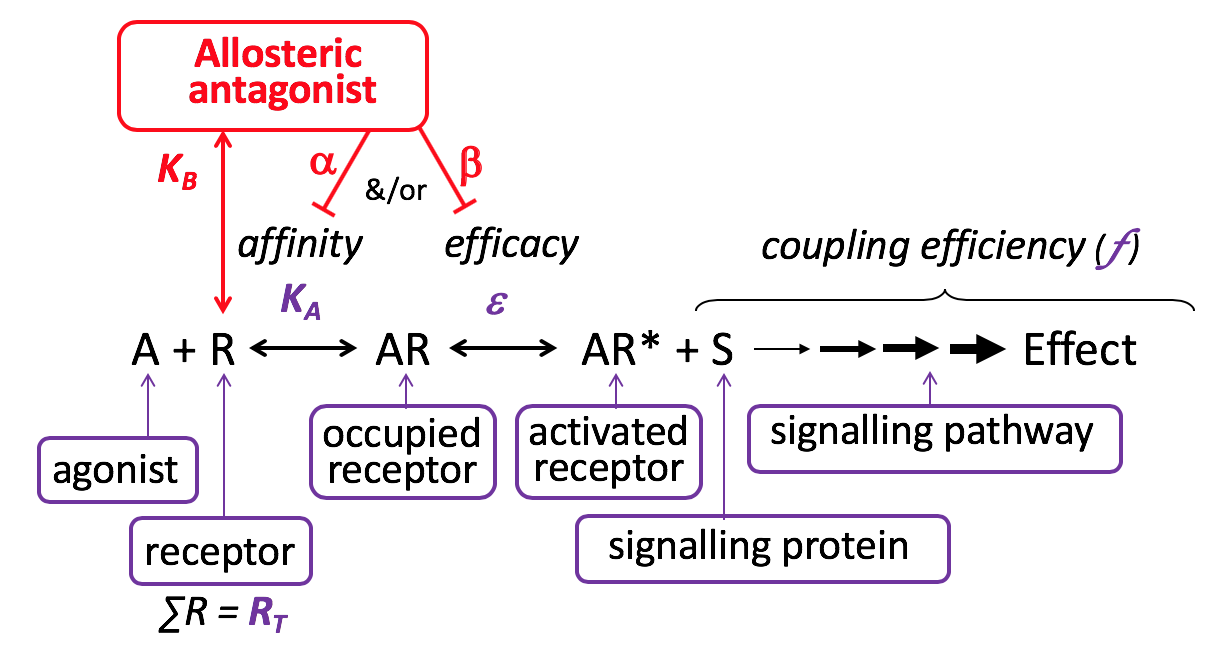
Relatively few clinically-used receptor antagonists are considered to act as negative allosteric modulators although this is an active area of research, e.g. maraviroc at the CCR5 receptor is an allosteric antagonist. In contrast, drugs such as the benzodiazepines act as positive allosteric modulators and enhance the binding affinity of the agonist

Agonist

Affinity

Affinity is a measure of the strength of binding of a drug to a receptor (both agonists and antagonists have affinity), and depends on the existence of chemical forces of attraction between the agonist and the receptor binding site (e.g. most commonly ionic bonds, hydrogen bonds, van der Waals forces). The strength of binding (affinity) depends upon the respective 3-D structures of the agonist and binding site – the strength of binding dissipates markedly as the distance between the agonist and binding site increases. High affinity agonists bind to binding sites at low concentrations, whereas low affinity agonists bind at higher concentrations. The affinity of ligands (agonists and antagonists) can be quantitated using the Equilibrium Dissociation Constant (KA), which is the concentration of ligand needed to occupy (bind to) 50% of receptors. KA is also the ratio of the rate the ligand (agonist or antagonist) leaves the receptor binding site (koff) and the rate it approaches the receptor binding site (kon). The KA value is inversely proportional to the affinity (high affinity ligands have low KA values) and is typically measured in drug binding assays (plots of [ligand] versus fractional receptor occupancy). As the [ligand] increases the fraction of receptor bound increases nonlinearly (rectangular hyperbolic function) to form a maximal asymptote (from which RT can be determined). Colloquially, “affinity is what brings the drug to the receptor”.


Intrinsic Efficacy

Intrinsic Efficacy is the property of the agonist that enables it, once bound, to change the conformation of the receptor (activation), such that it alters the activity of downstream signalling pathways to produce a change in cellular activity. Efficacy is measured in relative terms, having no absolute scale – but different ligands have clearly different efficacies – full agonists have higher efficacies than partial agonists, and antagonists typically have no efficacy (bind to but don’t activate the receptor). Thus, different agonists have different inherent capacities to induce a response, and equal cellular responses can be achieved by different fractional receptor occupancies. Colloquially, efficacy is “what the drug does once it binds to the receptor”.

Cell

Receptor Density

Receptor Density is the total number of receptors, expressed in terms of unit area of membrane, or per cell, or per unit mass of protein. Proportional to the quantity Bmax (the maximal specific binding of a ligand, often expressed in units of mol ligand/mg protein, or ligands bound/cell) measured in radioligand binding studies. The relationship between Bmax and N is influenced by the number of ligand binding sites possessed by each receptor. For most receptors there is one binding site for the endogenous agonist, although for ligand-gated ion channels (e.g. nicotinic acetylcholine receptor), this is generally more than one.


Coupling Efficiency

Coupling Efficiency is a cell-dependent parameter describing the efficiency of the signalling pathways that couple (link) the activated receptor to the measured effect. Some cells have high coupling efficiencies, meaning that activation of a relatively small number of receptors can lead to a large cellular response. Other cells may have low coupling efficiencies (perhaps due to low expression / activity of a key signalling pathway component) and high levels of receptor activation may produce relatively small cellular responses.

Allosteric Antagonist

Cooperativity Factor

The Cooperativity Factor α indicates the maximum effect produced by the allosteric antagonist on agonist affinity – a value of 0.1 indicates that the allosteric antagonist can produce up to a 10-fold reduction in agonist affinity. Observe the effects of changing the affinity and/or cooperativity factor (α) of the Allosteric Antagonist on the shape and position of the Agonist dose-response curve by moving the red slider along the grey bar to the right or left to increase or decrease the value of the characteristic, respectively.


Questions
There are no more questions. Would you like to try again?

Answer

Effect of an Allosteric Antagonist on Agonist Dose Response Curve
 Allosteric Antagonist

Allosteric Antagonist (Efficacy)

Allosteric antagonists bind reversibly to receptors, without activating the receptor, at a site that is different from the agonist binding site. Allosteric antagonists reduce agonist affinity &/or efficacy, thereby inhibiting agonist-induced effects. They are also referred to as negative allosteric modulators (NAMs). Unlike competitive antagonists, the effects of an allosteric antagonist are saturable – this is because once the allosteric site is saturated, there are no further allosteric effects on the agonist. Allosteric antagonism is another form of non-competitive antagonism, as a receptor can bind both the agonist and the allosteric antagonist simultaneously.

Efficacy Chart
Agonist

Affinity

Affinity is a measure of the strength of binding of a drug to a receptor (both agonists and antagonists have affinity), and depends on the existence of chemical forces of attraction between the agonist and the receptor binding site (e.g. most commonly ionic bonds, hydrogen bonds, van der Waals forces). The strength of binding (affinity) depends upon the respective 3-D structures of the agonist and binding site – the strength of binding dissipates markedly as the distance between the agonist and binding site increases. High affinity agonists bind to binding sites at low concentrations, whereas low affinity agonists bind at higher concentrations. The affinity of ligands (agonists and antagonists) can be quantitated using the Equilibrium Dissociation Constant (KA), which is the concentration of ligand needed to occupy (bind to) 50% of receptors. KA is also the ratio of the rate the ligand (agonist or antagonist) leaves the receptor binding site (koff) and the rate it approaches the receptor binding site (kon). The KA value is inversely proportional to the affinity (high affinity ligands have low KA values) and is typically measured in drug binding assays (plots of [ligand] versus fractional receptor occupancy). As the [ligand] increases the fraction of receptor bound increases nonlinearly (rectangular hyperbolic function) to form a maximal asymptote (from which RT can be determined). Colloquially, “affinity is what brings the drug to the receptor”.


Intrinsic Efficacy

Intrinsic Efficacy is the property of the agonist that enables it, once bound, to change the conformation of the receptor (activation), such that it alters the activity of downstream signalling pathways to produce a change in cellular activity. Efficacy is measured in relative terms, having no absolute scale – but different ligands have clearly different efficacies – full agonists have higher efficacies than partial agonists, and antagonists typically have no efficacy (bind to but don’t activate the receptor). Thus, different agonists have different inherent capacities to induce a response, and equal cellular responses can be achieved by different fractional receptor occupancies. Colloquially, efficacy is “what the drug does once it binds to the receptor”.

Cell

Receptor Density

Receptor Density is the total number of receptors, expressed in terms of unit area of membrane, or per cell, or per unit mass of protein. Proportional to the quantity Bmax (the maximal specific binding of a ligand, often expressed in units of mol ligand/mg protein, or ligands bound/cell) measured in radioligand binding studies. The relationship between Bmax and N is influenced by the number of ligand binding sites possessed by each receptor. For most receptors there is one binding site for the endogenous agonist, although for ligand-gated ion channels (e.g. nicotinic acetylcholine receptor), this is generally more than one.


Coupling Efficiency

Coupling Efficiency is a cell-dependent parameter describing the efficiency of the signalling pathways that couple (link) the activated receptor to the measured effect. Some cells have high coupling efficiencies, meaning that activation of a relatively small number of receptors can lead to a large cellular response. Other cells may have low coupling efficiencies (perhaps due to low expression / activity of a key signalling pathway component) and high levels of receptor activation may produce relatively small cellular responses.

Allosteric Antagonist

Cooperativity Factor

The Cooperativity Factor β indicates the maximum effect produced by the allosteric antagonist on agonist efficacy. Observe the effects of changing the affinity and/or cooperativity factor (β) of the Allosteric Antagonist on the shape and position of the Agonist dose-response curve by moving the red slider along the grey bar to the right or left to increase or decrease the value of the characteristic, respectively.


Questions
There are no more questions. Would you like to try again?

Answer

Effect of an Allosteric Antagonist on Agonist Dose Response Curve
 Functional Antagonist

Functional Antagonist

Functional antagonists are agonists that produce a functional effect in the cell that is the opposite of that produced by another agonist (e.g. agonist A constricts smooth muscle, whereas agonist B relaxes smooth muscle). The net effect produced depends upon the relative properties of the respective agonists (affinity & efficacy) and their signalling pathways (RT & coupling efficiency).

Functional Chart

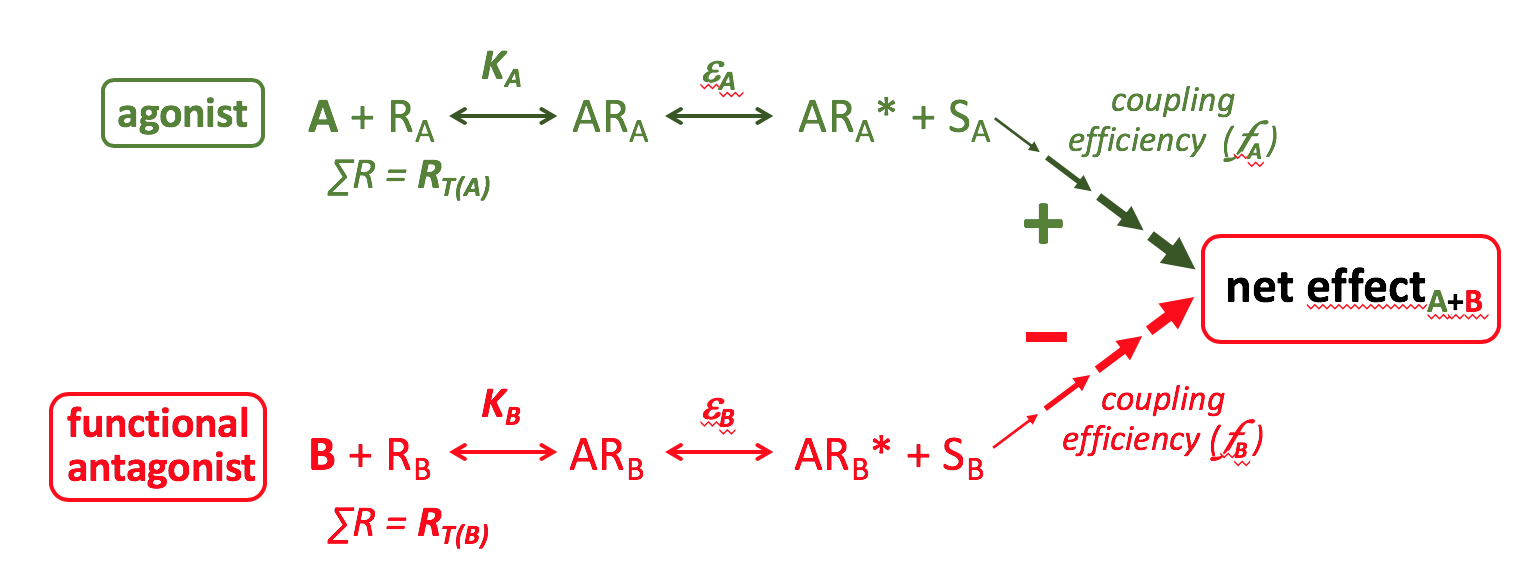
An example of a functional antagonist would be salbutamol, which by activating β2-adrenoceptors on airway smooth muscle and producing relaxation can functionally antagonise airway smooth muscle contraction induced by a wide array of spasmogenic agonists including acetylcholine, histamine and leukotrienes, each acting through their own specific receptors.

Agonist

Affinity

Affinity is a measure of the strength of binding of a drug to a receptor (both agonists and antagonists have affinity), and depends on the existence of chemical forces of attraction between the agonist and the receptor binding site (e.g. most commonly ionic bonds, hydrogen bonds, van der Waals forces). The strength of binding (affinity) depends upon the respective 3-D structures of the agonist and binding site – the strength of binding dissipates markedly as the distance between the agonist and binding site increases. High affinity agonists bind to binding sites at low concentrations, whereas low affinity agonists bind at higher concentrations. The affinity of ligands (agonists and antagonists) can be quantitated using the Equilibrium Dissociation Constant (KA), which is the concentration of ligand needed to occupy (bind to) 50% of receptors. KA is also the ratio of the rate the ligand (agonist or antagonist) leaves the receptor binding site (koff) and the rate it approaches the receptor binding site (kon). The KA value is inversely proportional to the affinity (high affinity ligands have low KA values) and is typically measured in drug binding assays (plots of [ligand] versus fractional receptor occupancy). As the [ligand] increases the fraction of receptor bound increases nonlinearly (rectangular hyperbolic function) to form a maximal asymptote (from which RT can be determined). Colloquially, “affinity is what brings the drug to the receptor”.


Intrinsic Efficacy

Intrinsic Efficacy is the property of the agonist that enables it, once bound, to change the conformation of the receptor (activation), such that it alters the activity of downstream signalling pathways to produce a change in cellular activity. Efficacy is measured in relative terms, having no absolute scale – but different ligands have clearly different efficacies – full agonists have higher efficacies than partial agonists, and antagonists typically have no efficacy (bind to but don’t activate the receptor). Thus, different agonists have different inherent capacities to induce a response, and equal cellular responses can be achieved by different fractional receptor occupancies. Colloquially, efficacy is “what the drug does once it binds to the receptor”.

Cell

Receptor Density

Receptor Density is the total number of receptors, expressed in terms of unit area of membrane, or per cell, or per unit mass of protein. Proportional to the quantity Bmax (the maximal specific binding of a ligand, often expressed in units of mol ligand/mg protein, or ligands bound/cell) measured in radioligand binding studies. The relationship between Bmax and N is influenced by the number of ligand binding sites possessed by each receptor. For most receptors there is one binding site for the endogenous agonist, although for ligand-gated ion channels (e.g. nicotinic acetylcholine receptor), this is generally more than one.


Coupling Efficiency

Coupling Efficiency is a cell-dependent parameter describing the efficiency of the signalling pathways that couple (link) the activated receptor to the measured effect. Some cells have high coupling efficiencies, meaning that activation of a relatively small number of receptors can lead to a large cellular response. Other cells may have low coupling efficiencies (perhaps due to low expression / activity of a key signalling pathway component) and high levels of receptor activation may produce relatively small cellular responses.

Functional Antagonist
Cell
Questions
There are no more questions. Would you like to try again?

Answer

Effect of a Functional Antagonist on Agonist Dose Response Curve
  • About
  • ⋅
  • Instructions
  • ⋅
  • Contact

Creative Commons © 2018

About

Summary about the project
Agonists produce effects in cells by activating receptors and downstream signalling pathways. This app contains an interactive “Dose Response Visualiser” which allows users to alter agonist-dependent factors (affinity, intrinsic efficacy) and/or cell-dependent factors (receptor density, coupling efficiency) and observe in real time how this changes the agonist dose-response relationship.

Agonist-induced effects can be blocked by drugs called antagonists, which are amongst the most widely used class of drug in medicine. There exist many different types of antagonists, named on the basis of how they block the agonist-induced effect: competitive, irreversible, allosteric and functional antagonists. Within the “Dose Response Visualiser”, users can observe the different patterns of effect produced by each of these antagonists (and the influence of antagonist concentrations and affinity) on the agonist dose-response relationship.

Quantitative analysis of the effect of competitive antagonists on agonist-induced effects is a powerful method for identifying the receptors that mediate agonist-induced effects (Schild analysis), and is used in drug discovery and receptor characterisation. The app contains a “Schild Plot Generator”, where users can select the properties of agonists and antagonists and generate Schild Plots, and work through a series of theoretical questions and experimental scenarios that build proficiency and enhance understanding of key Schild concepts.

These newly developed proficiencies and understandings can then be tested using the “Schild Analysis Quiz” tool within the app, were users are provided with a series of Schild Plots obtained to 5 antagonists acting on a single receptor subtype within a common cell, and users are challenged to analyse each of the Schild Plots using the SPIKES approach to deduce which single receptor subtype is mediating the agonist-induced response. Feedback is provided for each of the literally 1000s of different quiz questions.

Thus, SPIKESfunc is an interactive, educational application that boosts proficiency in the interpretation of functional pharmacological data through the visual and quantitative analysis of agonist and antagonist dose-response relationships. SPIKESfunc can be used in conjunction with SPIKESbind (or SPIKESmate), a complementary interactive educational app designed to enhance the proficiency in the interpretation of binding pharmacological data.

The SPIKESfunc application was created by Cameron Turner, Daniel Brown, Harry Brooker and Thai Nguyen, undergraduate students of the Professional Computing unit (CITS3200) at The University of Western Australia, as directed by Associate Professor Peter Henry of the Division of Pharmacology, School of Biomedical Sciences, UWA.

References

- Black JW, Leff P. (1983) Operational models of pharmacological agonism. Proc R Soc Lond B Biol Sci. 220(1219):141-62.

- Christopoulos A, Kenakin T (2002) G protein-coupled receptor allosterism and complexing. Pharmacol Rev. 54(2):323-74.

- Christopoulos A (2014) Advances in G protein-coupled receptor allostery: from function to structure. Mol Pharmacol. 86(5):463-78.

- Ehlert FJ. (2015) Functional studies cast light on receptor states. Trends Pharmacol Sci. 36(9):596-604.

- Kenakin, T.P. (2004) A Pharmacology Primer: Theory, Application, and Methods. First Edn. Elsevier Academic Press, San Diego, CA, USA.

- Kenakin T. (2006) Data-driven analysis in drug discovery. J Recept Signal Transduct Res. 26(4):299-327.

- Kenakin T, Jenkinson S, Watson C. (2006) Determining the potency and molecular mechanism of action of insurmountable antagonists. J Pharmacol Exp Ther. 319(2):710-23.

- Kenakin T, Watson C, Muniz-Medina V, Christopoulos A, Novick S. (2012) A simple method for quantifying functional selectivity and agonist bias. ACS Chem Neurosci. 3(3):193-203.

- Kenakin T. (2017) A Scale of Agonism and Allosteric Modulation for Assessment of Selectivity, Bias, and Receptor Mutation. Mol Pharmacol 92(4):414-424.

- Keov P, Sexton PM, Christopoulos A (2011) Allosteric modulation of G protein-coupled receptors: a pharmacological perspective. Neuropharmacology 60(1):24-35.

- Leff P, Martin GR, Morse JM. (1985) Application of the operational model of agonism to establish conditions when functional antagonism may be used to estimate agonist dissociation constants. Br J Pharmacol. 85(3):655-63.

- Lew MJ (1995) Extended concentration-response curves used to reflect full agonist efficacies and receptor occupancy-response coupling ranges. Br J Pharmacol. 115(5):745-52.

- Neubig RR, Spedding M, Kenakin T, Christopoulos A; International Union of Pharmacology Committee on Receptor Nomenclature and Drug Classification. (2003) International Union of Pharmacology Committee on Receptor Nomenclature and Drug Classification. XXXVIII. Update on terms and symbols in quantitative pharmacology. Pharmacol Rev. 55(4):597-606.

- Offermeier J, van den Brink FG. (1974) The antagonism between cholinomimetic agonists and beta-adrenoceptor stimulants. The differentiation between functional and metaffinoid antagonism. Eur J Pharmacol. 27(2):206-13.

- van den Brink FG (1973) The model of functional interaction. I. Development and first check of a new model of functional synergism and antagonism. Eur J Pharmacol. 22(3):270-8.

- van den Brink FG. (1973) The model of functional interaction. II. Experimental verification of a new model: the antagonism of beta-adrenoceptor stimulants and other agonists. Eur J Pharmacol. 22(3):279-86.

- Wyllie DJ, Chen PE. (2007) Taking the time to study competitive antagonism. Br J Pharmacol. 150(5):541-51.

Instructions

  • Dose-Response Visualiser
  • Schild Plot Generator
  • Schild Plot Analysis Quiz

Agonists bind to and activate receptors to induce changes in the activity of the receptor-expressing cells – a simple schematic of this process can be seen by clicking the red Agonist icon. The magnitude of these agonist-induced changes in cell activity are dependent on the concentration of the agonist, and are typically displayed using agonist dose-response curves (see default sigmoid- shaped Agonist Dose-Response Curve).

Agonist dose response curves provide important information regarding:

1. The maximum level of effect (response) induced by the highest concentrations of agonist (expressed as a percentage of the maximum change in cell activity, %Emax), and

2. The potency of the agonist, which is the concentration of the agonist producing a particular level of effect (response), usually expressed as the molar concentration of agonist producing 50% of the agonist’s maximum response (EC50 value).

The shape and position of agonist dose-response curves depend upon the properties of both the agonist (affinity and intrinsic efficacy) and the cell (receptor density and the coupling efficiency). Specific information about these parameters can be obtained by clicking the red icons.

Relative values for the four agonist and cell parameters are represented by red sliders, and can be changed by moving the sliders to the left (to decrease parameter value) or to the right (to increase parameter value) along the grey bar. Thus, this agonist dose-response visualiser enables you to visualise how the position and shape of the agonist dose-response curve changes in response to increases or decreases in agonist affinity or efficacy or in cell receptor density or coupling efficiency.

You can enhance your understanding of these key concepts of agonism by working through a series of Questions (see Questions window) that encourage the use of the Dose-Response Visualiser (see the ‘Question’ window). An Answer to each of the Questions posed can be obtained by clicking on the Reveal Answer icon.

Antagonists bind to receptors and inhibit agonist-induced responses. There exist different classes of antagonists, including Competitive antagonists, Irreversible antagonists, Allosteric antagonists and Functional antagonists. As their names suggest, these different classes of antagonist interact with the receptors in distinct ways, and likewise affect agonist dose-response curves in characteristic ways – thus each class of antagonist has its own visualiser. Further information about each of these classes of antagonists can be obtained by clicking the red Antagonist icon in each specific window. The magnitude of inhibitory effects produced by an antagonist depends upon both the concentration and affinity of the antagonist. By default, the effects produced by 1, 10, 100 and 1000 nM concentrations of antagonist on the agonist dose-response curves are displayed in red. The effect of changing the affinity of the antagonist on these effects can also be visualised by moving the red sliders in the Antagonist window to the left (to decrease antagonist affinity) or to the right (to increase antagonist affinity) along the grey bar. The extent to which the actions of the antagonist is dependent on the characteristics of the agonist (affinity, intrinsic efficacy) and/or cell (receptor density, coupling efficiency) can also be displayed by moving the appropriate sliders in the Agonist or Cell windows.

A return to default parameter values can be accomplished by clicking on the RESET button.

You can enhance your understanding of these key concepts of antagonism by working through a series of Questions (see Questions window) that encourage the use of the Dose-Response Visualiser (see the ‘Question’ window). An Answer to each of the Questions posed can be obtained by clicking on the Reveal Answer icon.

Schild analyses enable the determination of the affinity (KB) of a competitive antagonist at a particular receptor that is mediating the response produced by an agonist. Thus, the Schild analysis is a particularly powerful approach for classifying and identifying the functional roles played by various receptor subtypes.

As shown in the Dose-Response Visualiser, competitive antagonists produce a parallel, rightward shift of the agonist dose-response curve with no reduction in the maximum agonist-induced effect. The magnitude of the rightward shift increases as the [competitive antagonist] increases, and the magnitude of the shift (Dose Ratio) can be used to measure the affinity of the competitive antagonist for the receptor (Schild analysis). The Schild Plot plots the –log[antagonist] (M) on the x- axis against the calculated log(DR-1) on the y-axis (as can be seen in the Schild Plot window).

If certain conditions are met (linearity, unity of slope), then a Schild Plot can be used to generate a pA2 value, which is an estimate of the affinity of the competitive antagonist (KB value) for the receptor through which the agonist is producing the response. The pA2 is determined by measuring the value of the dose ratio (DR) at several antagonist concentrations, allowing an estimate of the antagonist concentration at which log(DR-1) is zero.

The calculated –logKB value of the antagonist can then be compared to known –logKi values of the antagonist obtained from the binding of the antagonist to pure populations of receptor subtypes, and through a process of elimination (incorporating the SPIKES approach), the receptor mediating the agonist-induced response identified.

In the Schild Plot Generator you can choose the characteristics of the agonist (affinity, intrinsic efficacy) and cell (receptor density, coupling efficiency) by moving the red sliders along the grey bar (as per Dose-Response Visualiser). Furthermore, you can select the affinity of the antagonist (in the Competitive Antagonist window) and select up to three [antagonist] (in the Schild Plot Analysis window) for use in the Schild Analysis, by entering specific values or by using the up/down arrows. The Schild Plot Generator determines the [Agonist] that produces 50%Emax for each agonist dose- response curve to calculate the dose ratio and log(DR-1) values, which are presented within the Schild Analysis Table. The log(DR-1) values for the 3 [antagonist] are then plotted to generate the idealised Schild Plot. Any of the agonist, cell of antagonist parameters can be changed at any time and the effect on the Schild plot shown in real time. A return to default parameter values can be accomplished by clicking on the RESET button.

You can enhance your understanding of the key concepts surrounding the theoretical and practical aspects of Schild Analysis by working through a series of Questions (see Questions window) that encourage the use of the Schild Plot Generator and the Reference Table of ‘-logKi values’. An Answer to each of the Questions posed can be obtained by clicking on the Reveal Answer icon. Completing these questions, together with an understanding of the SPIKES approach to interpreting Schild plot data, will prepare you well for the ‘Schild Plot Analysis Quiz’.

The ‘Schild Plot Analysis Quiz’ presents you with a series of Schild Plots obtained to 5 antagonists acting on a single receptor subtype within a common cell. The challenge is to analyse each of the Schild Plots to deduce which single receptor subtype is mediating the agonist-induced response.

A key factor in determining which receptor subtype is mediating the response is the application of the SPIKES approach. SPIKES is a mnemonic that provides a stepwise approach for analysing Schild plots.

Shape of the Schild Plot – should be linear. Nonlinearity is indicative of key assumptions of the Schild Analysis not being met (e.g. antagonism must be competitive) and makes the pA2 values potentially unreliable for KB determination. In the Quiz, analyse the shape of each Schild plot and select from the drop-down options (linear, nonlinear up, nonlinear down) the most appropriate description of the shape of the Schild Plot.

Position of the Schild Plot provides the pA2 value – i.e. x-axis intercept. If the pA2 is derived from a linear Schild plot with slope not significantly different from 1.0, then it can be converted to KB and be a true measure of the affinity of the antagonist for the receptor mediating the agonist-induced response. In the Quiz, enter the numerical value of the pA2 for each antagonist.

Inclination of the Schild Plot = slope of the Schild Plot, and should not be significantly different from value of 1.0. If slope < 1, pA2 is over-estimated & if slope > 1, then pA2 value is under-estimated. In the Quiz, determine the slope and select from the drop-down options (Slope=1, Slope<1, Slope>1, unsure) the most appropriate description of the slope for each antagonist Schild Plot.

KB is the antilog of the pA2 and is a direct measure of the affinity of the antagonist for the receptor mediating the agonist-induce response. The KB value can be reliably derived from pA2 only if the Schild plot is linear with unit slope. In the Quiz, determine whether the KB value can be reliably obtained from the pA2 value (based on the prior analysis of Shape (linear) and Inclination (slope=1) of each Schild plot) by selecting the appropriate response from the drop-down list (Yes, No, Unsure).

Elimination. If for any antagonist, there is at least a 1.0 log unit difference between the observed pA2 value and the known –logKi value at any particular receptor subtype (see reference Table of –logKi values), then that receptor subtype is unlikely to have mediated the agonist-induced response and can be eliminated from further analysis. In the Quiz, for each antagonist check the receptor box to indicate that that receptor has been eliminated.

Summation. In the Elimination process, each different antagonist is likely to have been able to eliminate one or more receptor subtypes as having mediated the agonist-induced response. By using the information obtained by using ALL the antagonists, a concerted process of elimination should leave just one receptor subtype as having mediated the response induced by the agonist. All obtained pA2 values should be close to the –logKi values for the sole non-eliminated receptor. In the Quiz, in the ‘Your Solution’ window select the sole receptor subtype that is mediating the response.

An additional feature of the Quiz is the inclusion of a hypothetical antagonist called Ant3311. The Schild plot for Ant3311 will not satisfy the requirements of linearity and/or unity of slope. In the Quiz, based on your analysis of the Ant3311 Schild plot and your understanding of why Schild plots may be nonlinear and/or have an slope different from 1.0, enter the most appropriate description of why Ant3311 Schild Plot is not ideal from the drop-down options (Ant3311 acts allosterically, Ant3311 acts irreversibly, high [Ant3311] are toxic, Ant3311 is a substrate of a saturable uptake process). To submit all your answers, click on the ‘Submit Answers’ button. This will take you to a new page that will indicate whether your submitted Solution was correct or incorrect. You have the option of ‘Amend your answers’ or to start a ‘New Quiz’.

Contact

Is something not working properly?
Have an idea about how can we improve the interactive tools?
Please contact us!

Peter Henry
Associate Professor
The University of Western Australia

Room 1.34, M Block,
School of Biomedical Sciences,
QEII Medical Centre

peter.henry@uwa.edu.au